Overview
The WinUI Cartesian charts offer interactive features such as crosshair, zooming, panning, trackball, tooltip, and selection. These features can be configured using developer-friendly APIs, allowing end users to experience smooth interactions.
Zooming and panning
Zooming and panning improve the readability of large numbers of data points. Zooming is performed by pinching, selecting a region, or double-tapping at the required position.

Tooltip
Displays a pop-up with additional information when the mouse pointer touches a data point.

Label template
Apply a data template to the tooltip view to display additional information about the data points.

UI customization
Customize the appearance of the tooltip view using the built-in APIs.
Selection
Interactively select and highlight a data point. This is widely used to navigate to another page of information about a selected data point or update other components on the same page based on the selected data point in the chart.

Point selection
Select data points in a series. Add colors and patterns to the selected data to make charts more attractive.

Series selection
Select a series from the chart series collection. Add patterns and colors to the selected series to enhance clarity and highlight important information.
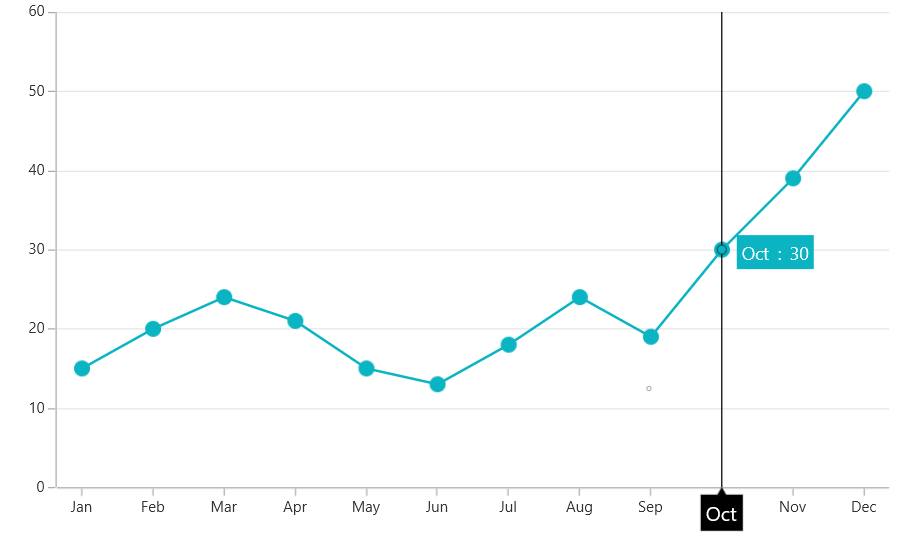
Trackball
View information about the data point closest to the touch contact point using the trackball in WinUI Cartesian charts.
Label template
Apply a data template to the trackball view to display additional information about the data points.

UI customization
Customize the appearance of the trackball label and line using the built-in APIs.
Crosshair
Crosshair is used to inspect or focus on an individual data point.
